My goal this month was to work on better entries when putting on a trade. When I evaluate my trading now, this is one of the biggest factors keeping it from being an A+ trade every time. Honing this in will allow me to make more profits in a shorter timeframe, hinder me from over-trading, and help keep FOMO at bay. If this month’s profits are any indication, I’d say I might be onto something here.
Now this might go without saying, but I really like to trade. I love all the drama and the act of opening and closing trades, and I want to do it all the time, forever and ever, amen. However, it is far better to do so when conditions are ripe, and that requires patience, I’m afraid.

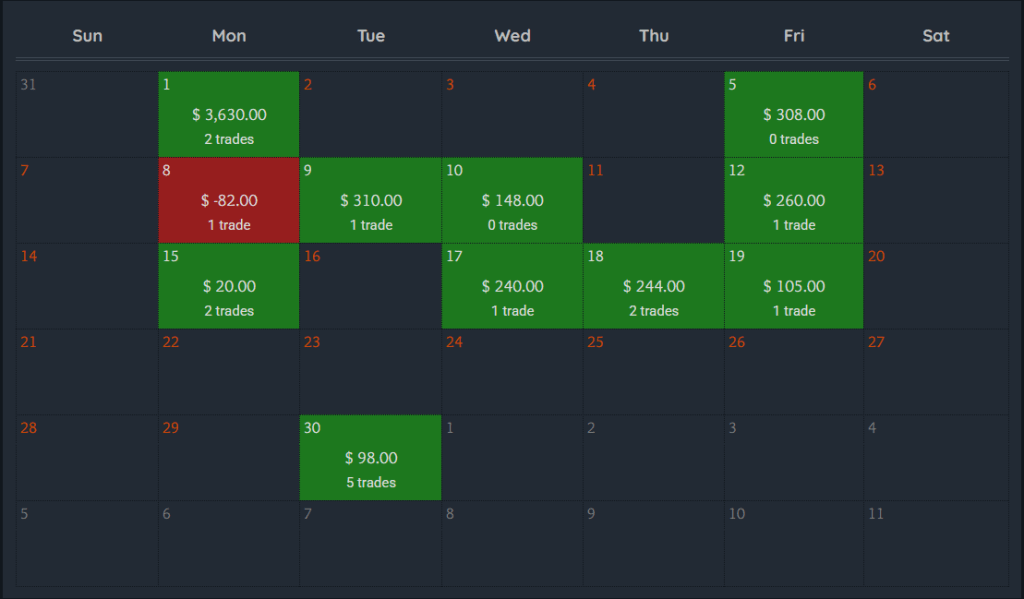
So when I had to sit, watch, and do nothing for the first 4 trading days of the month while I was waiting on the perfect setup, boy, was I chompin’ at the bit! But wouldn’t you know it, my patience paid off when some trades showed up on day 5 and I made $2,314 in one day!
In the past I would’ve entered other, weaker trades throughout the week, leaving money tied up for when a real trade showed itself, causing me to miss out on the bigger move.
In this episode I’d like to show you how I’m attempting to get better at timing when to enter and exit a trade. I’ll show you just a few simple things I look for that put the odds in my favor, and show you what it truly means to buy low and sell high. You can take this information home with you for free to make sure you’re not another silly retail trader who buys at the top.
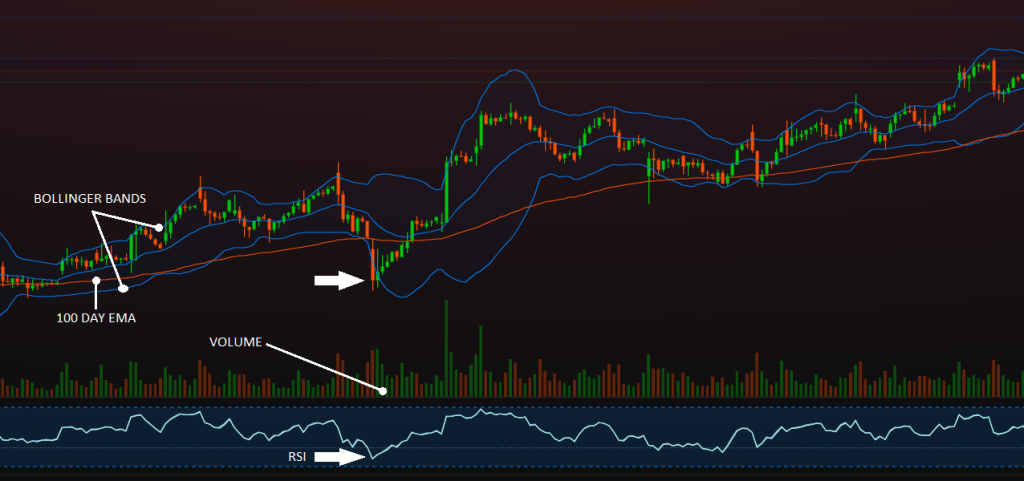
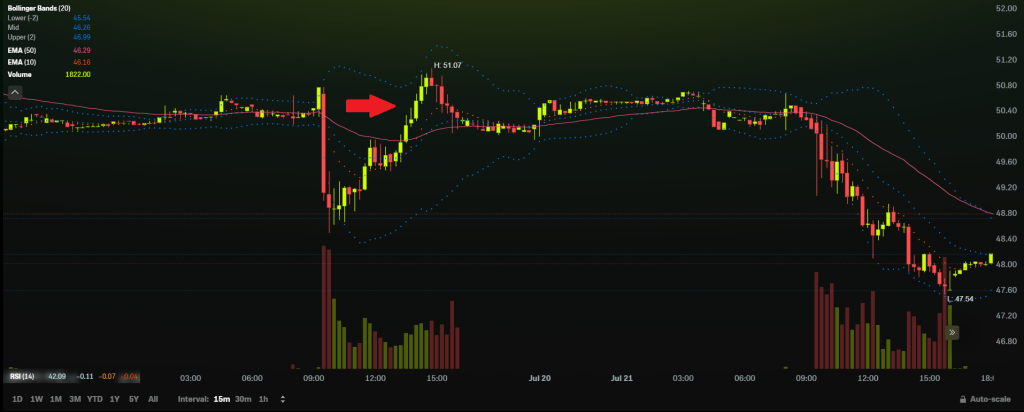
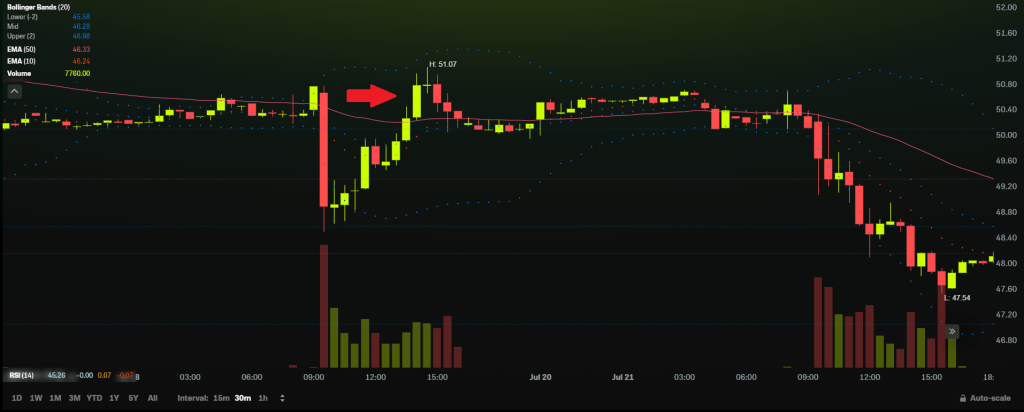
This is super simple stuff, just stick with me. I’ve labeled a few things on the chart above, and I’ll explain them below. I will be using the same chart throughout the examples, but will zoom and crop different areas so you can get a better look.
The Indicators
Indicators help traders confirm whether a price move is genuine (supported by momentum and volume) or likely to reverse (due to being overbought or extended).
They don’t predict the future, but they give insight into the supply, demand, and volatility of a stock. They help traders make informed decisions about when to buy or sell.
Below are the ones I commonly use and I’ll explain how I interpret and apply them.
Bollinger Bands
Seen here in blue, they simply have a top, bottom, and middle line with a shaded area in between. This indicator can show you when something is likely overbought or oversold. The blue line running in the middle of the bands is the 20 Day Exponential Moving Average and it acts as a baseline. It is the average price over the last 20 days.
When prices are volatile the band will widen, showing you the price range in which it will likely trade. The band will contract in periods of low volatility where the stock is trading sideways which can indicate a “price breakout” is near. This means a large swing in either direction could be just around the corner. You can think of it as the price being squeezed and then released with great force.
When the stock is trading sideways it is referred to as a period of consolidation. You have buyers (bulls) and sellers (bears) evenly matched and both sides are rallying their troops. Eventually one side overcomes the other by sheer volume and the price will dramatically skyrocket or tank for a period of time as the losing side closes their trades and runs for cover.

The top of the Bollinger Band is plus 2 standard deviations from the average price, the bottom is minus 2 standard deviations. There is only a 5% chance of the price going outside of the bands, so when it does happen it will usually quickly revert. These can be great entry and exit points but are few and far between.
Notice what happens each time the price touches the upper and lower parts of the Bollinger Band and also look for the rare instances it pops outside of the bands in the chart above. Sorta like bowling with those kiddie guard rails up, huh?
The thing to remember is this is a trailing indicator, meaning that it’s not predicting the future, it’s showing you what’s likely to happen based on past and current information. When the price is at the bottom of the band it can still continue to go down, trust me!
One way to put the odds even more in your favor is to wait for confirmation with something like the price retesting and bouncing off of one of the moving averages, which I explained here in a previous post and you can see take place in the example below.
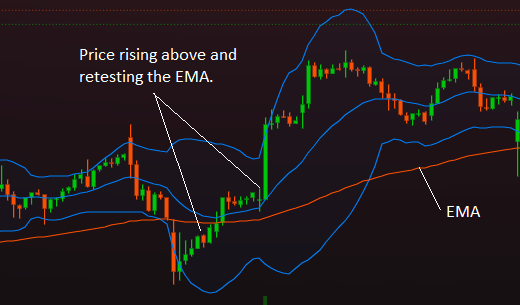
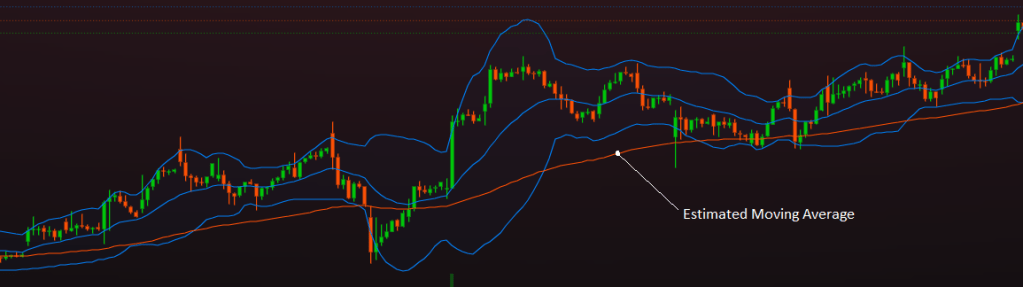
Estimated Moving Averages (EMA)
This is the horizontal, orange line on the chart showing the average price over the last X number of days and is a solid indicator to use for determining the health of a stock. It can act as strong support, meaning the price isn’t likely to go below that for long as buyers like to buy at that level. You can clearly see this in the chart, each time the stock dips down to touch the 100 Day EMA it quickly bounces back up. Being patient and waiting for these opportunities is the key to becoming a thousandaire like myself.
There are several different EMA ranges you can choose to overlay on your chart, I actually use several at a time. All stocks do not behave the same so you must take a second to see how the stock you’re trading behaves around these different indicators.
Does the stock always hug tight to the 50 Day EMA? Does it sometimes take a little tumble, touch the 100 or 200 Day EMA, then immediately shoot to the moon for a few days before settling back down?
It only takes a few seconds to interpret the story a chart is showing you. It’s also handy if you keep the list of stocks you trade relatively small. It’s better to get acquainted and have the feel for a few stocks than to be scattered trading whatever random ticker is popping that day. I’ve done around 80% of my trading this year on just one stock.
Prices usually revert to the mean. Prices can jump up and down, but they will move back to their average levels. I’m trying to show you how to capitalize on these swings, how you can make money off of other people’s fear and greed. The way God intended.
Relative Strength Index (RSI)
The primary use of the RSI is to determine if an asset’s price has moved too far, too fast, and if it might be due for a reversal. It measures momentum, not volume, and is another helpful piece of the puzzle.
To keep it simple you use this the same way as you would the Bollinger Bands. When the price reaches the top it could indicate a pullback is due to the stock being aggressively bought and now it might be considered slightly overvalued.
When the price reaches the bottom it could indicate that the stock has been aggressively sold and buyers might consider it a good buy at these levels as it’s slightly undervalued.
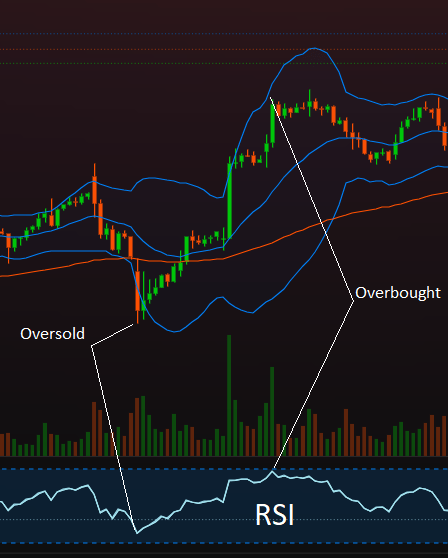
In the example above you can see where the price dips outside of the Bollinger Bands and also touches near the bottom of the RSI. This could be prime time to enter a trade.
Now it may seem like both of these indicators react the same, but you will often find instances where the RSI is doing the opposite of what the price is, and this means that a reversal is probably imminent and this is referred to as Divergence.
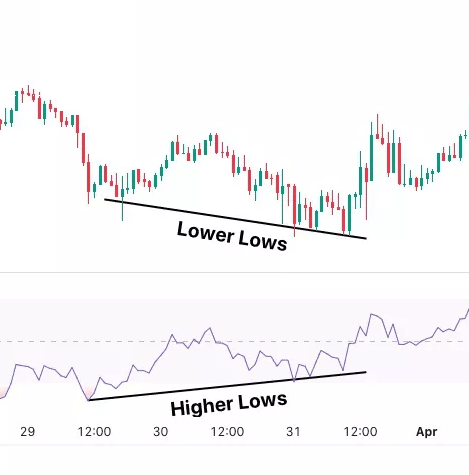
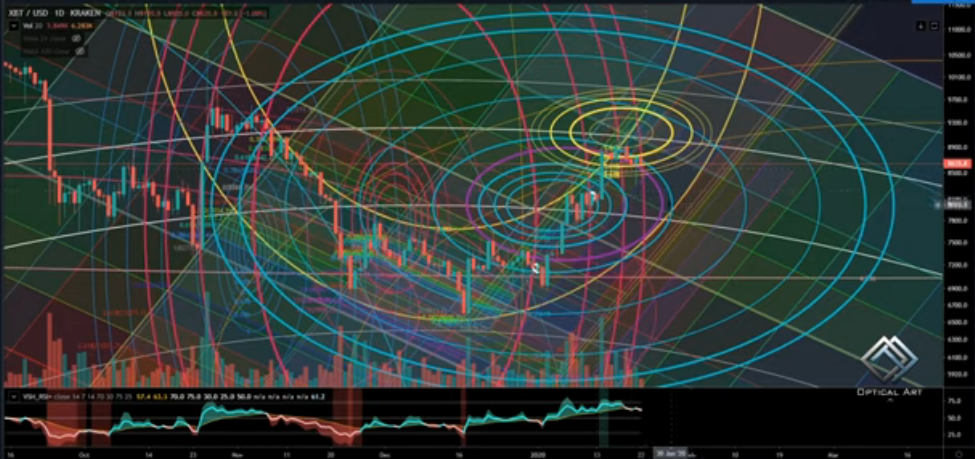
This is why it is important to use these indicators in conjunction with one another to get a view of the bigger picture and to confirm that everything is lining up.
All of these indicators are one trick in your bag and you wouldn’t make a decision based on a single one. It’s about reading the heavens and having all the stars line up in your favor.

Volume
This is one is crucial as it can confirm the strength of a price movement. Volume is the number of orders coming in. It’s traders showing up for all the excitement.
Traders analyze the relationship between price movement and volume to make better decisions. Below is how you might interpret these signals.
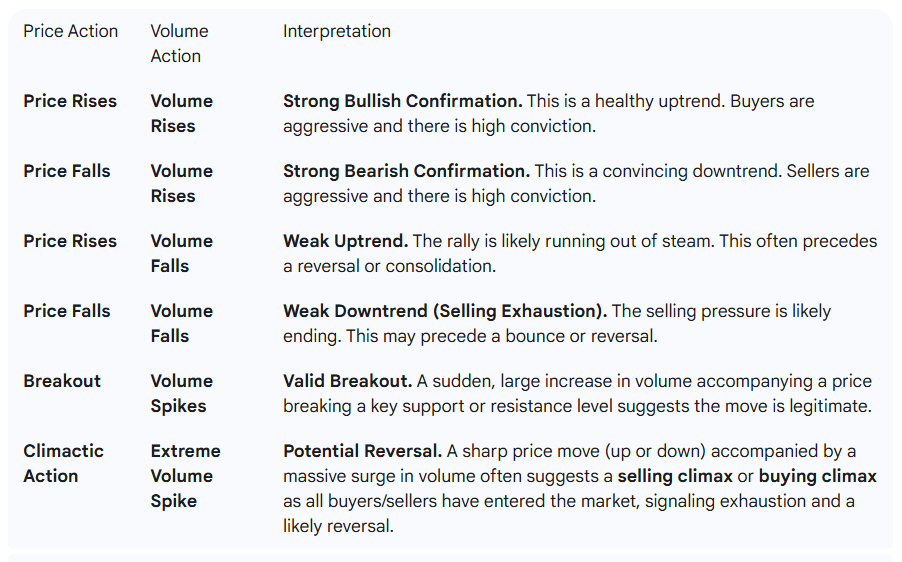
When price moves you want to take a look at the volume to see if it justifies the move. Sometimes price will jump up on very little volume and this usually means that the price will reverse soon. The price will lie to you sometimes. Volume should confirm the move.
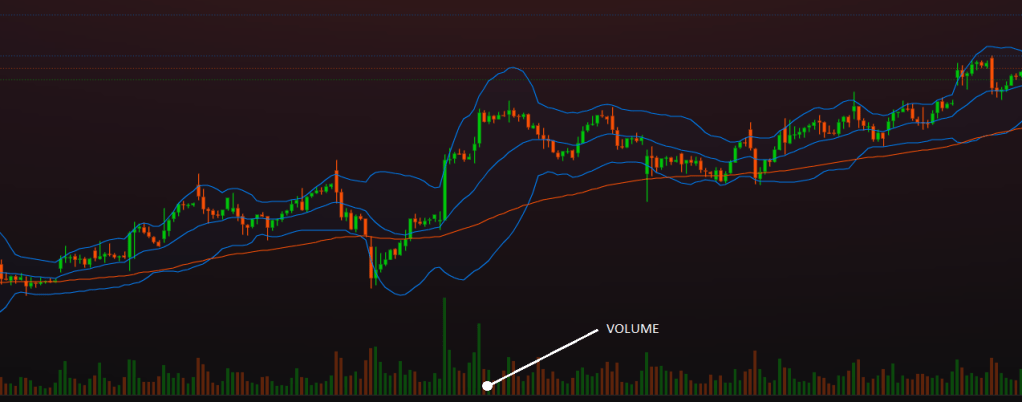
It’s easy, you just make sure those little bars at the bottom are substantial enough to push the price up, as you can see in the large swing in the chart above. You got a big swing in price with lots of volume there supporting it.
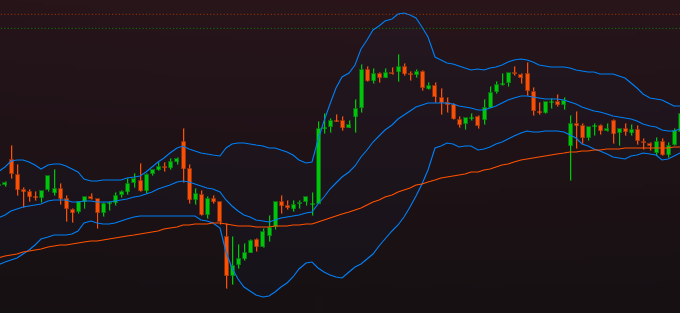
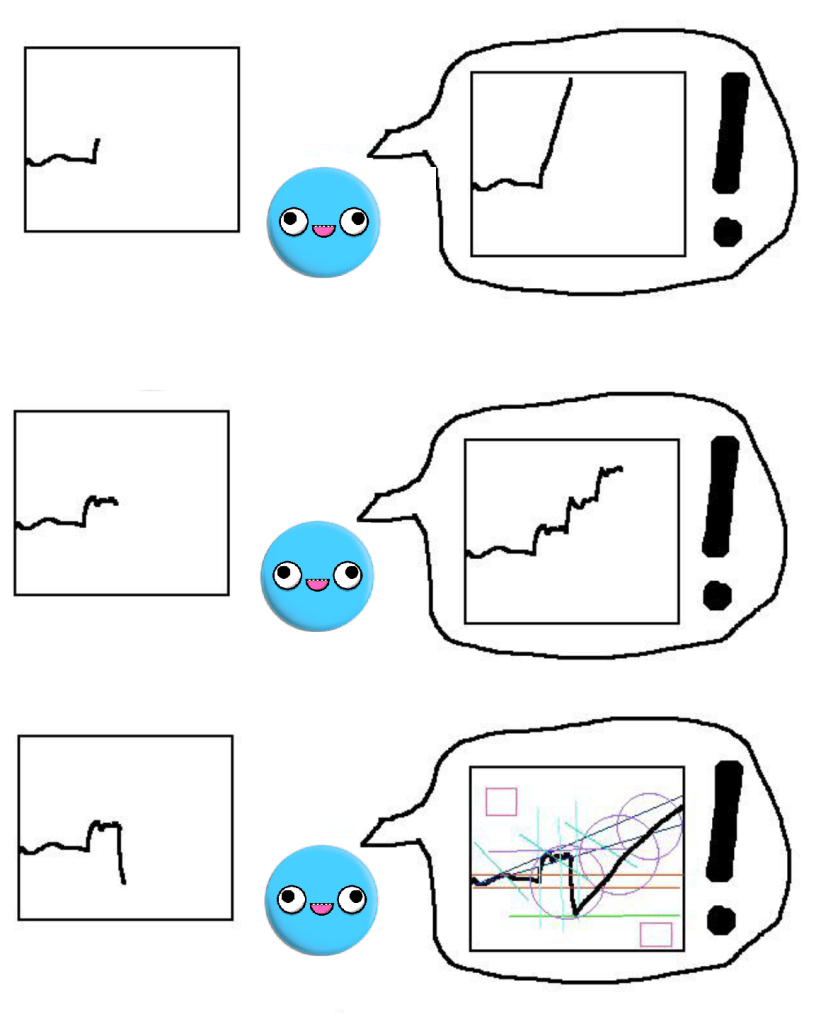
Let’s take a look at what happens when volume doesn’t back up the price movement.

See how the volume isn’t telling the same story as the price movement? You will often see the price climb like this, but without confirmation from the volume it is likely to be a weak lil’ baby trend.
One last note is that it’s important to look at these different indicators on different timeframes, as well. If you planned on holding something for a while you wouldn’t make decisions based solely on the daily chart. You would also want to zoom out and look at the monthly and yearly chart, allowing you to see the greater trend. Things might look great today, but the one-month chart could be atrocious.
That wasn’t too bad, huh? Now you’re more informed than the average retail trader! How about that?!
If you’re new this may seem like a lot but it’s all pretty simple and straightforward. You can quickly reach a point where you’re able to look at any given chart and decipher a lot of information from it in a few seconds. It just takes time and experience. I’m not having to watch charts all day, I just like to sometimes. Trading does not have to be complicated. I do just fine keeping it simple and sticking to a few rules.
I hope this helps to demystify some of the process. I plan on gathering the more educational parts of my posts and putting them all onto a dedicated page so they can be easily referenced in the near future.
Mistakes Were Made
I’m only human. I let FOMO get the best of me one morning and jumped in on a trade. This usually isn’t that big of a deal but things were different this time.
Now that I sometimes trade on margin I have to keep a certain amount of cash in the account as collateral. The amount of collateral required is based on how risky the stock I’m trading is. I mostly trade with stocks that only require 25%, making them on the safe side of the spectrum.
For instance, if the stock’s price was $20 and I wanted to buy 100 shares on margin I would only have to put up $500 as collateral and not the full $2000.
But every once in a while I’ll briefly trade a more volatile stock and that’s what went wrong here. It required 75% collateral and I completely forgot about that while also not even noticing until it was too late. When I hastily jumped into the trade it put me close to receiving a Margin Call instantly.
Not only was it a terrible movie, in more ways than the obvious one, but a margin call is also a frightening event I hope to avoid! This occurs when your broker requires you to put in more money because the value of the assets that you own on margin have dropped.
If you do not deposit more capital within a few days the broker will close out any positions and sell whatever is necessary from your portfolio without your permission to try and recoup as much of their money as they can.
Fun Fact: Elon risked a Margin Call earlier this year after he threw up a Nazi sign in front of God and everybody causing Tesla shares to plummet. The problem was that Elon bought Twitter using Tesla shares as collateral and then they lost half their value after the incident.
Newsweek – Could Elon Musk Face Margin Call Over Tesla Stock?
I hope to keep a clean record and never receive a Margin Call. This was the reason behind me closing the trade out for a loss and it was the right thing to do. This was not an easy decision as you’ll discover you’ll always find room for more hope when things aren’t going your way. You just KNOW the trade is going to turn around and will find the means to justify it.
I was faced with the decision to either hold on to the trade and hope for the best (gamble) or cut my losses. If the stock continued to go down I would lose even more money and risk a margin call. My other choice was to play it safe and close for a small loss. I chose the latter and chose correctly, as the stock did not behave the way I predicted and would’ve lost even more money.
I made over $2000 the previous day but losing that $82 completely overshadowed that. Funny how the brain works. I could only focus on that tiny loss. I felt silly and was disappointed in myself. I knew that this very day would come and I would be standing here before you in judgement.
These types of lessons tend to stick with me and hopefully this will be the last time I let excitement get the best of me. Rules are important.
I had another small loss, but it was purely an accidental, user error. I lost $24 because I closed a trade instead of opening a second one by mistake. It could’ve been way worse so in the future I will take the time to slow down and double check what I’m doing.
Monthly Roundup
I have decided to forgo my monthly percentage goals and trade solely on vibes. I don’t want to force trades or have any more pressure than there needs to be. Now that we’re waiting for the perfect setups, we will more than likely be trading a little less. I went into some detail about this last month in case you missed it.
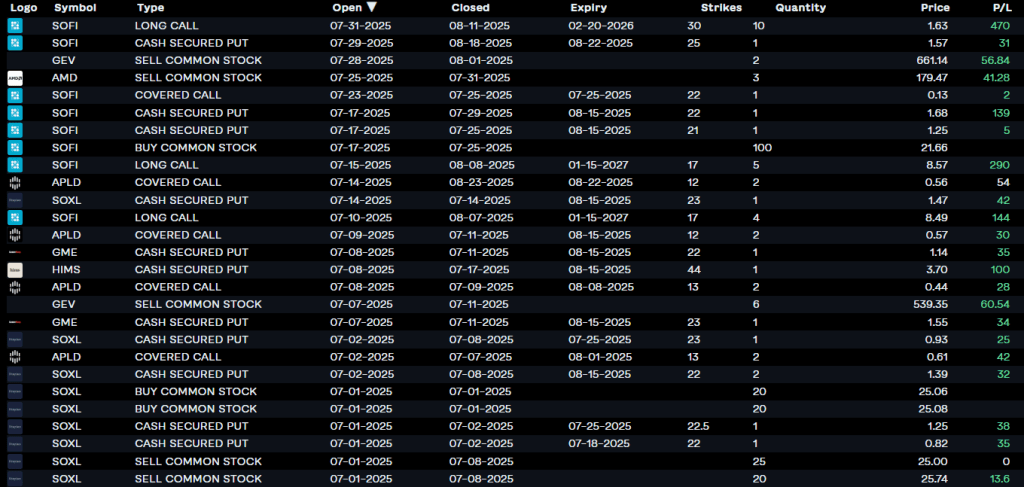
In September I made $5,281 in total.
I’ve increased my accounts by $15,273 so far in the year of our Lord 2025.
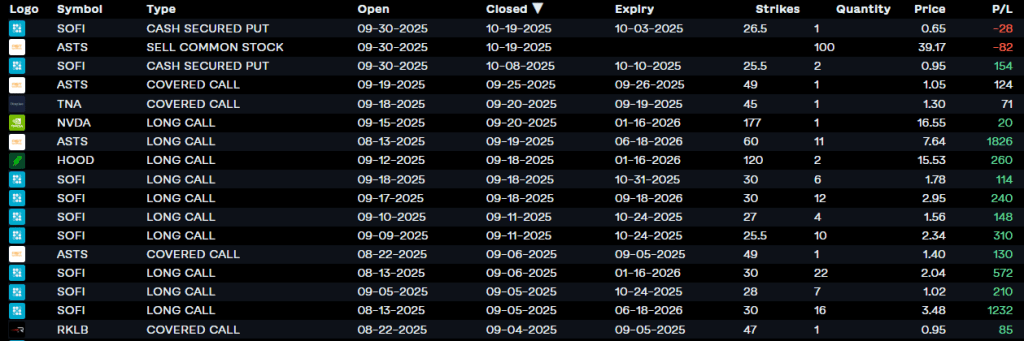
Here are the trades.
My monthly performance in 2025.

Since buckling down and really sticking to these guidelines I’ve laid out, I have freed up a ton of time and energy while bringing in my best month yet. When a setup shows itself you can learn to act without overthinking and do the dang thang. When things don’t line up you learn to be patient and wait for something better. The beauty of rules is that they take out the whole decision-making process.
In the stock market you figure out what kind of trading you like to do, you set some solid rules for yourself, learn from your mistakes, and you will watch your account grow.
In life you figure out what kind of person you want to be, you set some solid rules that direct your compass towards that ideal, learn from your mistakes, and you will watch yourself grow and be of better use to the people around you.
Now make like you’re a bull breed and show ’em how to strut,
Chris


If you’d like to give trading on Robinhood a try you can click my referral link HERE and we’ll both get some free stock.
Furthering Education:
This short video shows you why the market moves and how things will trade in a range before breaking out to find a new range. These breakouts are what we’re looking for and this will help visualize the whole concept.
A great video going into more detail about volume, why it matters, and how to read it.
This nice little video explains quite a few things I discussed today. If I hadn’t just found it right now at the end of editing this I would’ve told you to just watch this instead during those parts.