The Universe has a subtle way of giving you little warnings before having to resort to more drastic measures to get your attention.
I’ve been into tarot for a few years now and I have a tendency to overexplain myself so to not come off too weird so I’ll just say I do not see them as some sort of spooky fortune telling device that prophesies your unchangeable future.
Often when I draw a card I’m reminded of a character trait that I could lean into a little more. Self-control, generosity, nurturing, patience, compassion – all these things are inside of us but for one reason or another they sometimes aren’t the easiest to bring to light. But the suggestion of one small change can make big, lasting changes when compounded over time. You hold a lot of wisdom inside of you, these cards are just something else to help remind you of that. They’re a tool to help you on a journey of self-reflection if that’s your thing.
On my last card pull I had gotten the King of Swords and kinda half-assed the whole thing to be honest. I didn’t give it the time and thought that I normally would. I have a whole journal dedicated to these sort of mystical endeavors but I wrote nothing about it, just went through the motions.
There are 78 cards in a tarot deck so imagine my surprise as I shuffled and pulled the King of Swords again a week or so later. This time I decided to sit with it and really contemplate what I could learn from this card and apply it to my life.
- Strategic Action – Don’t just react—plan. Consider long-term consequences before making a move.
- Clear Thinking – Strip away bias, wishful thinking, and emotional fog. See the situation as it truly is, not as you hope it to be.
When I trade I can easily get swept up in my emotions. I trade impulsively or over-trade more times than I’d like to admit. Although I’ve only had, like, 4 losing trades this year I could be doing better by not making silly mistakes that leave my money tied up for a long time or messing with cheap meme stocks. So to accomplish this I needed to start working on a plan and a set of rules. And let me tell ya, doing this lead me down a whole ‘nother rabbit hole that has completely changed the way I’m currently trading and will be even more apparent next month. (I’m already at my monthly goal of 10% in the first two weeks of August. – Future Chris)
I’m very pleased with my results from trading but there has been a nagging feeling that I needed to refine my rules a little. I shoot from the hip a tad too much for my liking. This was made clear after some LEAPS I bought shot up to $2000 in profit then went negative and I did nothing because I didn’t have an exit strategy for that position. I told ya’ll last month that I would be buying more LEAPS but I didn’t take the time to figure out when to take profit on them causing me to not make as much money as I could have.
Hope is not a strategy in trading. You need to be able to take any situation, look at it with total impartiality, and then come to a balanced and insightful decision.

I needed to hunt for setups like the American cougar hunts for food. Not searching frantically everywhere wasting energy, but up in a tree watching the patterns of prey and striking when the opportunity arises.
I am, what they call, a technical trader meaning I make decisions based off of chart patterns and not from reading a bunch of boring financial statements.
So I needed to decide on a setup that I felt the most comfortable with and just trade that, it’s just that simple. And that leads us to …
The 50-Day EMA
When you’re looking at a chart there are all kinds of indicators that you can overlay and use to help make more informed decisions. One of those indicators is the 50-day EMA (Estimated Moving Average). It tracks the average price of a stock over the past 50 trading days and is a good indicator of the current trend. A rising 50-day EMA suggests an uptrend, while a falling one indicates a downtrend.
The 50-day EMA can act as a dynamic support level in an uptrend (price bounces off it) and a resistance level in a downtrend (price struggles to break above it). Things trading above the 50-day EMA is good sign. Things trading below it could mean something’s amiss.
Let’s take a look at the setup that I’m on the hunt for rawrrr…

You can see on my little chart there that after a huge drop the price will rise above the 50-day EMA (pink horizontal line), pull back some to re-test it, and will either rocket upward or take the fast elevator down. This is usually a volatile moment so you want to be correct when choosing if and when to enter the trade.
That’s why it’s so important to wait for conformation after a retest. You want a nice, fat candle with plenty of volume supporting it. I miss out on a small amount of profits from not getting in at the very bottom but I’ve been faked out so many times it’s not even funny. So I will take a small decrease in profits in exchange for putting the odds greatly in my favor. I don’t want ALL the profits, only some of them.
By waiting for an event like this to happen (and it does often) I greater my chances astronomically because I’m going with the flow of the markets and not guessing what’s going to happen next.
I’m tired of trying to time tops and bottoms. I’ve had to change my mindset to watching the action play out and sometimes waiting days to take on a trade. I’m not a market wizard and it doesn’t do much good being a contrarian in this area of my life. I gotta go with the flow.
Candlesticks


Candlesticks will show you a more detailed picture of what’s going on with price more clearly than the plain line graph we’re all used to seeing. There’s tons of videos on learning how to read candlesticks so I won’t go into that right now but it’s a skill worth picking up.
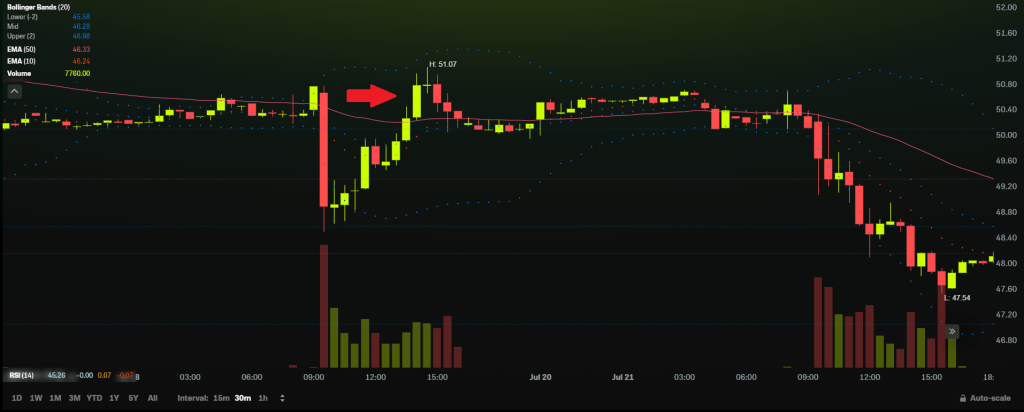
You can toggle the time frame that each candle represents from nanoseconds up to days. Until recently I hadn’t realized how much I was also getting faked out by looking at the shorter timeframe candles. I needed to scale back and look at the bigger picture so I started with the 15 minute then eventually settled on the 30 minute and 1 hour candle.
Here’s an example of how different those candlesticks can appear when looking at the same stock event on different timeframes.
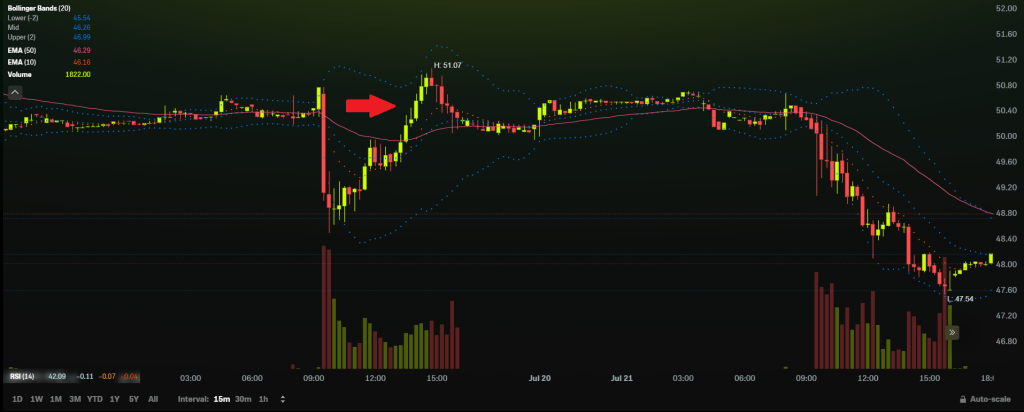

… kinda like life, huh? Sometimes we need to zoom out and slow down a little to get a better vantage point and see how things are going and how they might play out from here if we continue down the same path so we don’t rush into things …
Anyways, being in a trade way longer than you planned while clogging up money because you got impulsive and bought on the first big swing you see feels bad, man. I’m still in a trade I did that exact same thing with 2 months ago. I’m here to help you not do the same.
There’s a lot of trading going on second by second but I don’t need to hear all that noise and that’s what I’m doing by looking at the shorter 5-15 min timeframe candles. The trend of the hour is stronger than the trend of the minute. Tides vs waves.
“Rushing into action, you fail.
Trying to grasp things, you lose them.
Forcing a project to completion,
you ruin what was almost ripe.

Therefore the Master takes action
by letting things take their course.
He remains as calm at the end
as at the beginning.

He has nothing,
thus has nothing to lose.
What he desires is non-desire;
what he learns is to unlearn.

He simply reminds people
of who they have always been.
He cares about nothing but the Tao.
Thus he can care for all things.”
― Lao Tzu, Tao Te Ching
Alright, wrap it up already Lord have mercy!
Now usually this is everyone’s favorite part where I say, “My monthly goal is to increase my accounts by 10%”, but after much thought I’m gonna give myself a little more wiggle room and shoot for a range of 5-10%. Things change up quite a bit next month so I feel now is a good time for the switch. In July I achieved an increase of 4.5% bringing in $757.20 total.
I know what you may be thinking and it may seem as if I’m lowering expectations and the bar for myself but this decision will hopefully be made more clear in next month’s post. I can assure you that is not the case.
I’m up 82% this year increasing my accounts by $7,411 so far in the year of our Lord 2025. Even though it keeps touching all time highs, the S&P 500 has only returned 9.5% in this same timeframe.

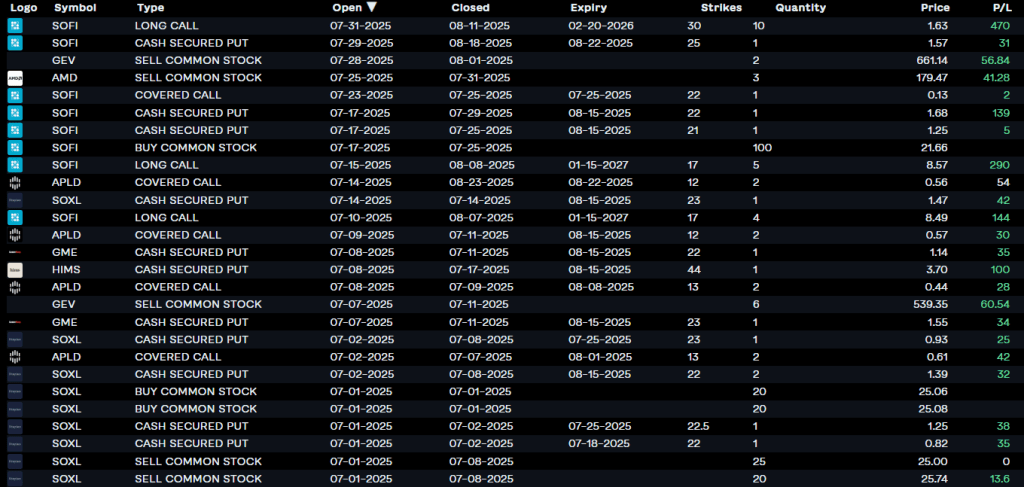
Here are the trades.
Here’s a table of my monthly performance compared to the S&P 500’s.
| Profit | % Change | S&P 500 | |
| Jan | $1,214 | +13.7% | +2.7% |
| Feb | $1,741 | +16.85% | -1.42% |
| March | $339 | +2.8% | +5.75% |
| April | $182 | +1.46% | -0.76% |
| May | $459 | +3.64% | +5.9% |
| June | $3,840 | +38.6% | +5% |
| July | $757 | +4.5% | +2.2% |
10 Things I Hate About Skew
And before we go, it’s not really visible in my charts here, yet, but in the spirit of transparency I did take a big loss that’s spread out over a couple of months. I finally admitted defeat and closed out all of my SMST trades for around a $900 loss. Didn’t let it get to me and put the remainder of that money to good use. I love being a contrarian but I’ll have better luck going with the flow and trading with momentum, not trying to bet that a stock is going down when they usually just want to go up, even when their dumb.
This was an inverse ETF based off MicroStrategy which I still think will crash and burn but obviously not in the timeline I had hoped.
Thanks to SMST going through a reverse stock split, some weird math, and a call with my brokerage it took me a long time to calculate this loss into my stats. I will still need go back and edit some numbers.
This one stock has been behind the only losing trades I’ve made this year and the only time I followed someone else blindly. I went in heavy, too, and paid the price. Important lesson here. I would’ve had over 100 trades with no losses had it not been for this hiccup.
But, in the end, this all made me consider that maybe the real profits are the friends we make along the way.
From our charts to yours,
Chris
PS – I hope this goes without saying and, perhaps, something I should’ve been stating this whole time, but obviously this is not financial advice. I’m just showing you what I do and trying to spare the people close to me from some of my rants.
If you’d like to give trading on Robinhood a try you can click my referral link HERE and we’ll both get some free stock.
